
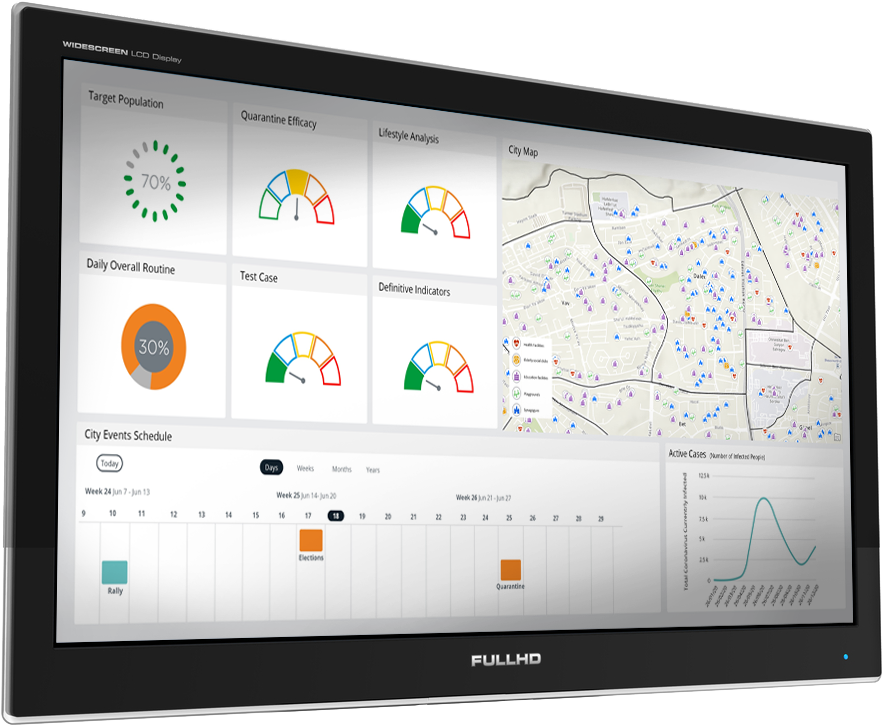
Municipal / Civil & Business continuity Support during crisis
Operational Planning and Reaction to maintain a semblance of daily life during the crisis
Planning and implementing steps for gradual return to routine
to create a current situation report and map out existing patterns
as a base for crisis management
Forecasting, minimizing damage, real time analysis & conclusions
Signals crisis alerts by area/location
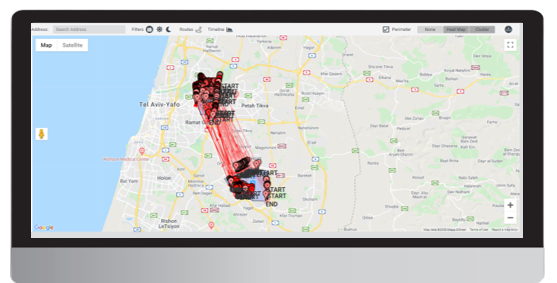
Dual radius search + routs (Ben Gurion National Airport & Bnei Brak)
Route & destination tracking by device (from Ben Gurion NA)

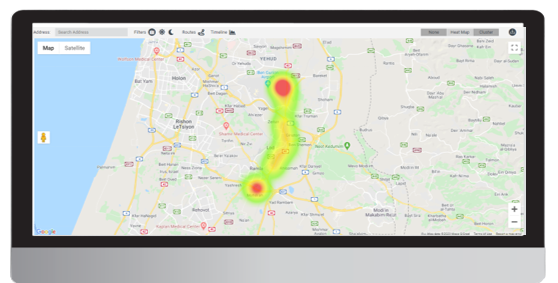
Zoom in to singles, Bnei Brak area, color symbology by device
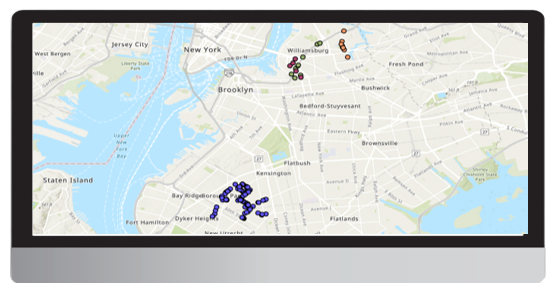
Zoom in to singles, NY area, color by device in adherence to BB area (left)